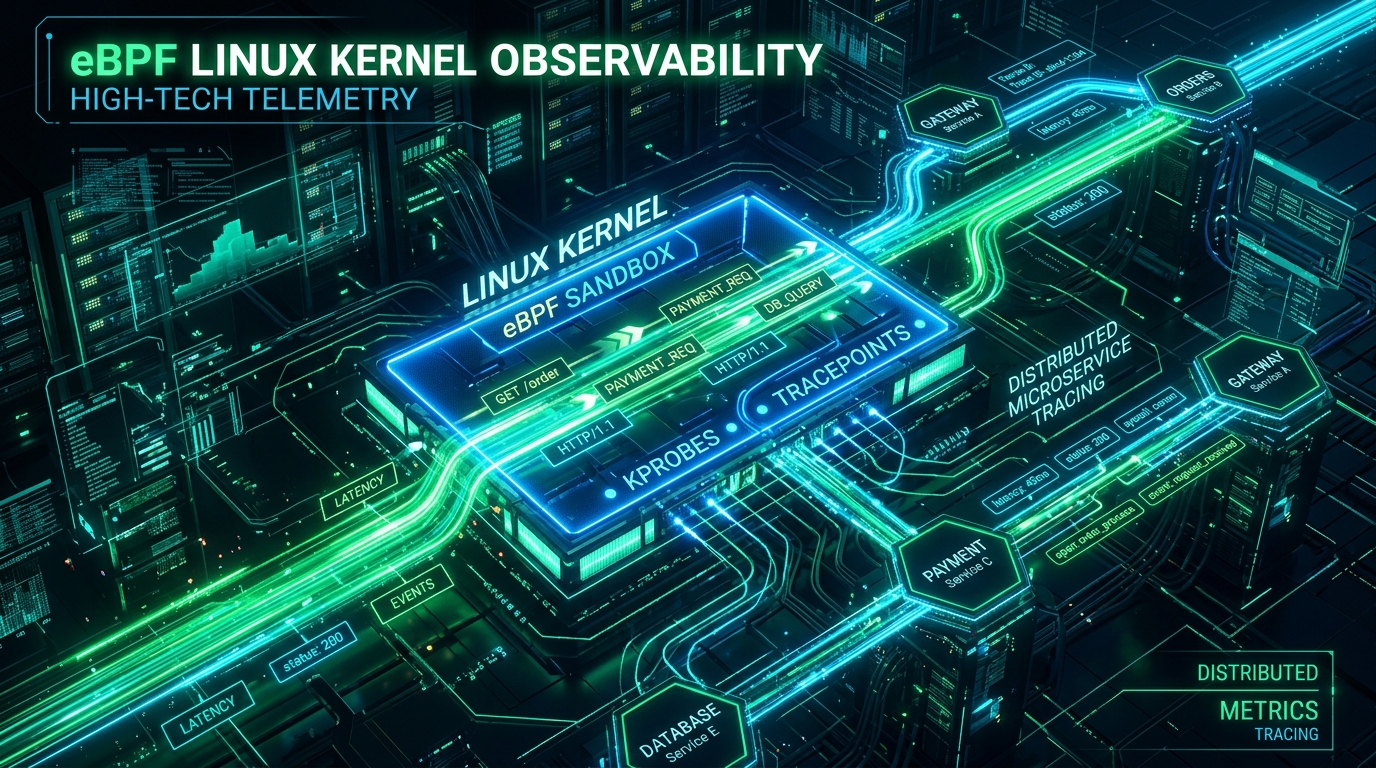
In high-throughput distributed systems, achieving complete observability is notoriously expensive. Traditional application performance monitoring (APM) tools require invasive code instrumentation, proprietary vendor SDKs, heavy JSON serialization, and CPU-intensive sidecar proxies (like Envoy or Istio) that introduce measurable network latency hops on every inter-service call.
More critically, user-space APM agents are completely blind to what happens beneath the application layer: kernel socket queue stalls, TCP retransmissions, thread scheduling latency, and disk I/O lock contention.
eBPF (Extended Berkeley Packet Filter) has fundamentally transformed Linux observability. By executing sandboxed, verified bytecode directly inside the Linux kernel, eBPF allows engineers to extract rich distributed traces, capture database latencies, inspect raw network packets, and profile CPU bottlenecks with sub-1% CPU overhead and zero application code modifications.
In this guide, we explore the internal architecture of eBPF, break down kernel probe attachment points, walk through high-impact bpftrace diagnostic recipes, and demonstrate how to capture microservice telemetry at the kernel boundary.
The Observability Tax: User-Space APMs vs. In-Kernel eBPF
To understand the revolutionary nature of eBPF, consider how traditional user-space instrumentation compares to kernel-level event extraction:
| Dimension | Traditional User-Space APM / Sidecar | eBPF In-Kernel Observability |
|---|---|---|
| Code Changes Required | High (Vendor SDK imports, recompilation, container rebuilds) | Zero (Kernel captures events automatically) |
| CPU & Memory Overhead | 5% to 15% (Data serialization, thread locks, memory copying) | < 0.5% (In-kernel aggregation via BPF Maps) |
| Latency Overhead | 1ms–3ms added per request hop (Sidecar proxy interception) | Zero network hop overhead |
| Visibility Scope | Application layer only (Blind to OS & network anomalies) | Full Stack (Application, System Calls, Socket Queues, Hardware I/O) |
How eBPF Works Under the Hood: Safety & In-Kernel Execution
The Linux kernel is the ultimate source of truth. Every HTTP request, SQL query, thread creation, and file access must make a System Call (syscall) to the kernel.
eBPF allows developers to write custom event-handler programs that hook into these system calls safely:
+-------------------------------------------------------------------------+
|                              USER SPACE                                 |
|                                                                         |
|   +-----------------------------------------------------------------+   |
|   |         Applications / Containers (Node.js, Go, PHP-FPM)        |   |
|   +-----------------------------------------------------------------+   |
|                                    |                                    |
|                             System Calls (read, write, connect, etc.)   |
|                                    v                                    |
+-------------------------------------------------------------------------+
|                             LINUX KERNEL                                |
|                                                                         |
|   +---------------------+      +------------------------------------+   |
|   |    eBPF Verifier    | ---> |        eBPF In-Kernel VM           |   |
|   | (Proves safety,     |      | (JIT compiled to native CPU code)  |   |
|   |  no infinite loops) |      +------------------------------------+   |
|   +---------------------+                        |                      |
|                                                  v                      |
|   +-----------------------------------------------------------------+   |
|   |    Attachment Points: Tracepoints, Kprobes, Uprobes, XDP        |   |
|   +-----------------------------------------------------------------+   |
|                                                  |                      |
|                                                  v                      |
|   +-----------------------------------------------------------------+   |
|   |    BPF Maps (Lockless In-Memory Hash/RingBuffers for Telemetry) |   |
|   +-----------------------------------------------------------------+   |
+-------------------------------------------------------------------------+
1. The eBPF Verifier: Guaranteeing Zero Crashes
Unlike traditional Linux Kernel Modules (LKMs), which can crash the entire operating system with a single null pointer dereference, eBPF programs must pass a strict static analysis verification check before execution:
- The verifier checks all possible execution paths to guarantee the program cannot read uninitialized memory or dereference out-of-bounds pointers.
- It enforces loop termination constraints (preventing infinite loops from freezing the CPU core).
- Once verified, the in-kernel JIT compiler converts the bytecode directly into native machine instructions for maximum execution speed.
2. BPF Maps: Lockless Telemetry Storage
Instead of passing raw, high-volume event streams across the user-space boundary on every trigger, eBPF programs aggregate metrics inside BPF Maps (in-memory key-value stores, histograms, and ring buffers). User-space collectors (like Prometheus exporters or Cilium agents) periodically read the aggregated summary, resulting in near-zero context-switching overhead.
The 4 Primary eBPF Attachment Points
eBPF programs can attach to several distinct layers of the Linux system depending on what telemetry is needed:
1. Tracepoints (Static Kernel Hooks)
Statically defined hooks built into the Linux kernel source code by kernel maintainers. Because their interface remains stable across kernel upgrades, tracepoints are ideal for tracking standard events like process execution (sched:sched_process_exec) or network socket state changes (sock:inet_sock_set_state).
2. Kprobes and Kretprobes (Dynamic Kernel Hooks)
Dynamic probes that can attach to virtually any internal kernel function at runtime. kprobes fire upon function entry, while kretprobes fire upon function return, allowing engineers to calculate exact internal kernel execution durations.
3. Uprobes and Uretprobes (User-Space Function Hooks)
eBPF isn't limited to the kernel. uprobes attach to functions inside user-space ELF binaries or shared libraries (e.g., intercepting OpenSSL's SSL_write() and SSL_read() to trace encrypted HTTPS payloads before encryption happens).
4. XDP (eXpress Data Path)
Executes BPF code at the earliest possible network driver stage before the kernel allocates an sk_buff socket structure. XDP can filter or redirect millions of network packets per second at line rate (essential for ultra-fast DDoS mitigation and load balancing).
Hands-On: Production Diagnostic Recipes with bpftrace
bpftrace is a high-level tracing language for Linux eBPF that allows engineers to diagnose production performance bottlenecks in real time with single-line scripts.
Recipe 1: Live Block I/O Latency Histogram
Diagnose whether sluggish database queries are caused by disk controller latency:
# Plot disk I/O latency distribution in microseconds
sudo bpftrace -e '
kprobe:vfs_read { @start[tid] = nsecs; }
kretprobe:vfs_read /@start[tid]/ {
    @latency_us = hist((nsecs - @start[tid]) / 1000);
    delete(@start[tid]);
}'
Recipe 2: Sniffing All Outgoing TCP Connections (Real-Time)
Identify which microservices are establishing new outbound TCP handshakes and track connection latency:
# Trace outbound TCP connects across all processes
sudo bpftrace -e '
tracepoint:syscalls:sys_enter_connect {
    printf("%-8s %-16s (PID %d) connecting socket...\n",
           strftime("%H:%M:%S", nsecs), comm, pid);
}'
Recipe 3: Tracing Slow MySQL / PostgreSQL Queries via Kernel Syscalls
Detect slow database responses without enabling slow-query logs in database configuration:
# Monitor read() syscalls on PostgreSQL processes exceeding 50ms
sudo bpftrace -e '
tracepoint:syscalls:sys_enter_read /comm == "postgres"/ {
    @start[tid] = nsecs;
}
tracepoint:syscalls:sys_exit_read /@start[tid]/ {
    $dur = (nsecs - @start[tid]) / 1000000;
    if ($dur > 50) {
        printf("Slow Postgres Read: PID %d took %d ms\n", pid, $dur);
    }
    delete(@start[tid]);
}'
Writing a Minimal eBPF Program in C
Here is how a production eBPF program is written in C using the standard libbpf framework to intercept process executions:
// exec_tracer.bpf.c
#include
#include

// Define a BPF RingBuffer to stream events to user space
struct {
    __uint(type, BPF_MAP_TYPE_RINGBUF);
    __uint(max_entries, 256 * 1024); // 256KB buffer
} events SEC(".maps");

struct event_t {
    __u32 pid;
    char comm[16];
    char filename[64];
};

SEC("tracepoint/syscalls/sys_enter_execve")
int trace_execve(struct trace_event_raw_sys_enter *ctx) {
    struct event_t *e;

    // Reserve space in the ring buffer
    e = bpf_ringbuf_reserve(&events, sizeof(*e), 0);
    if (!e) return 0;

    e->pid = bpf_get_current_pid_tgid() >> 32;
    bpf_get_current_comm(&e->comm, sizeof(e->comm));

    // Safely copy string from user-space pointer into kernel buffer
    const char *filename_ptr = (const char *)ctx->args[0];
    bpf_probe_read_user_str(&e->filename, sizeof(e->filename), filename_ptr);

    // Submit event to user space
    bpf_ringbuf_submit(e, 0);
    return 0;
}

char LICENSE[] SEC("license") = "GPL";
The Modern eBPF Ecosystem: Tools You Should Know
| Project | Domain | Primary Use Case |
|---|---|---|
| Cilium | Kubernetes CNI & Service Mesh | Replaces iptables/kube-proxy with eBPF; sidecar-less service mesh |
| Pixie | Application Observability | Automatic HTTP/gRPC tracing, SQL query latency, and flame graphs |
| Falco | Cloud-Native Security | Real-time threat detection based on anomalous kernel syscall patterns |
| Parca / Pyroscope | Continuous Profiling | Always-on CPU and memory flame graphs across all cluster nodes |
Summary
eBPF represents a permanent paradigm shift in systems engineering. By elevating observability from high-overhead user-space SDKs to sandboxed in-kernel execution, you gain total visibility into distributed services, network latency, and operating system health—unlocking unprecedented diagnostic precision without imposing an observability tax on production workloads.